Geo Insights
Unified 3 standalone geo apps into one powerful tool - now in production and scaling with Shell, a major Middle East operator, YPF, and ExxonMobil
3 → 1
Apps consolidated
~2 months
Time to production
~2,100
Weekly uses (post-launch)
4
Beta clients
Up to 50
Offset wells supported
Overview
Role
Sr. Product Designer - sole designer
Team
1 PM · 1 Developer · 1 Designer
Timeline
~2 months from decision to production
Status
Live · March 2026 · actively evolving
Geo Insights is Corva's unified geoscience analysis tool - a single app that brings together well trajectory visualization, formation analysis, and geospatial context into one synchronized workspace. It allows drilling engineers and geologists to plot up to 50 offset well profiles, align them stratigraphically, and compare well behavior and performance with full geologic context.
The app supports three vertical scale modes - TVD (True Vertical Depth), RSD (Relative Stratigraphic Depth), and NSD (Normalized Stratigraphic Depth) - each flattening wells based on selected horizon tops to remove formation dipping factors and reveal true well placement within target zones.
Geo Insights launched in production in March 2026 and is currently in beta testing with Shell, a major Middle East operator, YPF, and ExxonMobil. The product has significant growth potential as the geoscience segment of Corva's platform expands.

Three apps that should have been one
Corva's geoscience toolkit had grown organically into three separate applications, each designed by me at different stages:
Well Map
Geospatial visualization of well surface locations and laterals, with filtering by rig, well status, and target formation. An interactive map layer that gave spatial context to drilling operations.
Formation Insights
Multi-well trajectory comparison tool. Engineers could plot subject wells against offsets in TVD, RSD, and NSD modes, aligning stratigraphically to compare well placement within target formations.
Target Formation Roadmap
Granular data visualization within target zones, showing parameters like ROP, MSE, Gamma Ray, and WOB binned as tightly as 0.5 ft to help locate optimal drilling depths at subzone levels.
Each app worked well individually. But users kept placing all three on the same dashboard - and that's where the problems started.
The trigger: A request came in to build a fourth app - Gun Barrel view (a vertical cross-section showing multiple horizontal wells with heatmap overlay). The PM proposed adding a separate filter app to synchronize all four. That felt wrong.
Before - Fragmented
✗No shared filters between apps
✗Redundant configuration everywhere
✗Selecting a well in one app doesn't highlight it in another
✗Dashboard feels fragmented
After - Geo Insights (1 unified app)
✓Shared filter state - configure once
✓Cross-highlighting across all views
✓One settings panel for everything
✓Coherent single-app workflow

Understanding what users actually needed
Before the consolidation, I conducted user research across multiple sessions to understand how people used the existing geo apps and what they needed from the new Gun Barrel view.
On Gun Barrel view
- Users saw it as a passive monitoring tool - expected to sit on a wide screen, looked at occasionally
- Users wanted bit trajectory shown as a heat-bubble visualization
- Strong request for cross-highlighting: hover in one view should highlight across all views
On Formation Insights / Well Correlator
- Metrics panel distracting and space-wasting - users wanted to minimize it
- Need to compare at least 2 formations, not just 1
- Should support 6–7 wells minimum, not just 3
- NPT events feature was well received
On Formation Evaluation (log viewer)
- Trace settings overwhelming - too many options visible at once
- Quick toolbar icons needed instead of menus
- Screenshot-friendliness important - data should be visible without hovering
“Users kept asking for cross-app features - highlight a well on the map and see it in the trajectory view. These requests were impossible with separate apps.”

From fragmentation to a unified product
4.1
The consolidation decision
When the Gun Barrel request came in, the PM proposed building it as a fourth standalone app with a shared filter widget. I pushed back. Adding more apps would only deepen the fragmentation problem. Instead, I proposed merging Well Map, Formation Insights, Target Formation Roadmap, and the new Gun Barrel view into a single application with a shared state layer.
This was a significant architectural and design decision. It meant rethinking navigation, layout, and the entire settings model - but it would unlock everything users had been asking for: synchronized filters, cross-highlighting, and a coherent workflow. The team agreed. We had approximately 2 months to ship it.
4.2
Designing the unified experience
The core design challenge was combining four distinct visualization types into a single app without overwhelming the user. Each view serves a different analysis need, but they all operate on the same data: wells, formations, and drilling parameters.
The unified settings panel became the backbone - one place to select wells, set formations, configure filters, and have every view update simultaneously.
Well Map
Geospatial well locations & laterals
Formation Insights
Multi-well trajectory profiles (TVD / RSD / NSD)
Target Formation Roadmap
Granular subzone data (ROP, MSE, GR, WOB)
Gun Barrel
Vertical cross-section with heatmap overlay
Shared layer
Unified settings panelSynchronized filtersCross-highlighting on hoverConsistent color coding
4.3
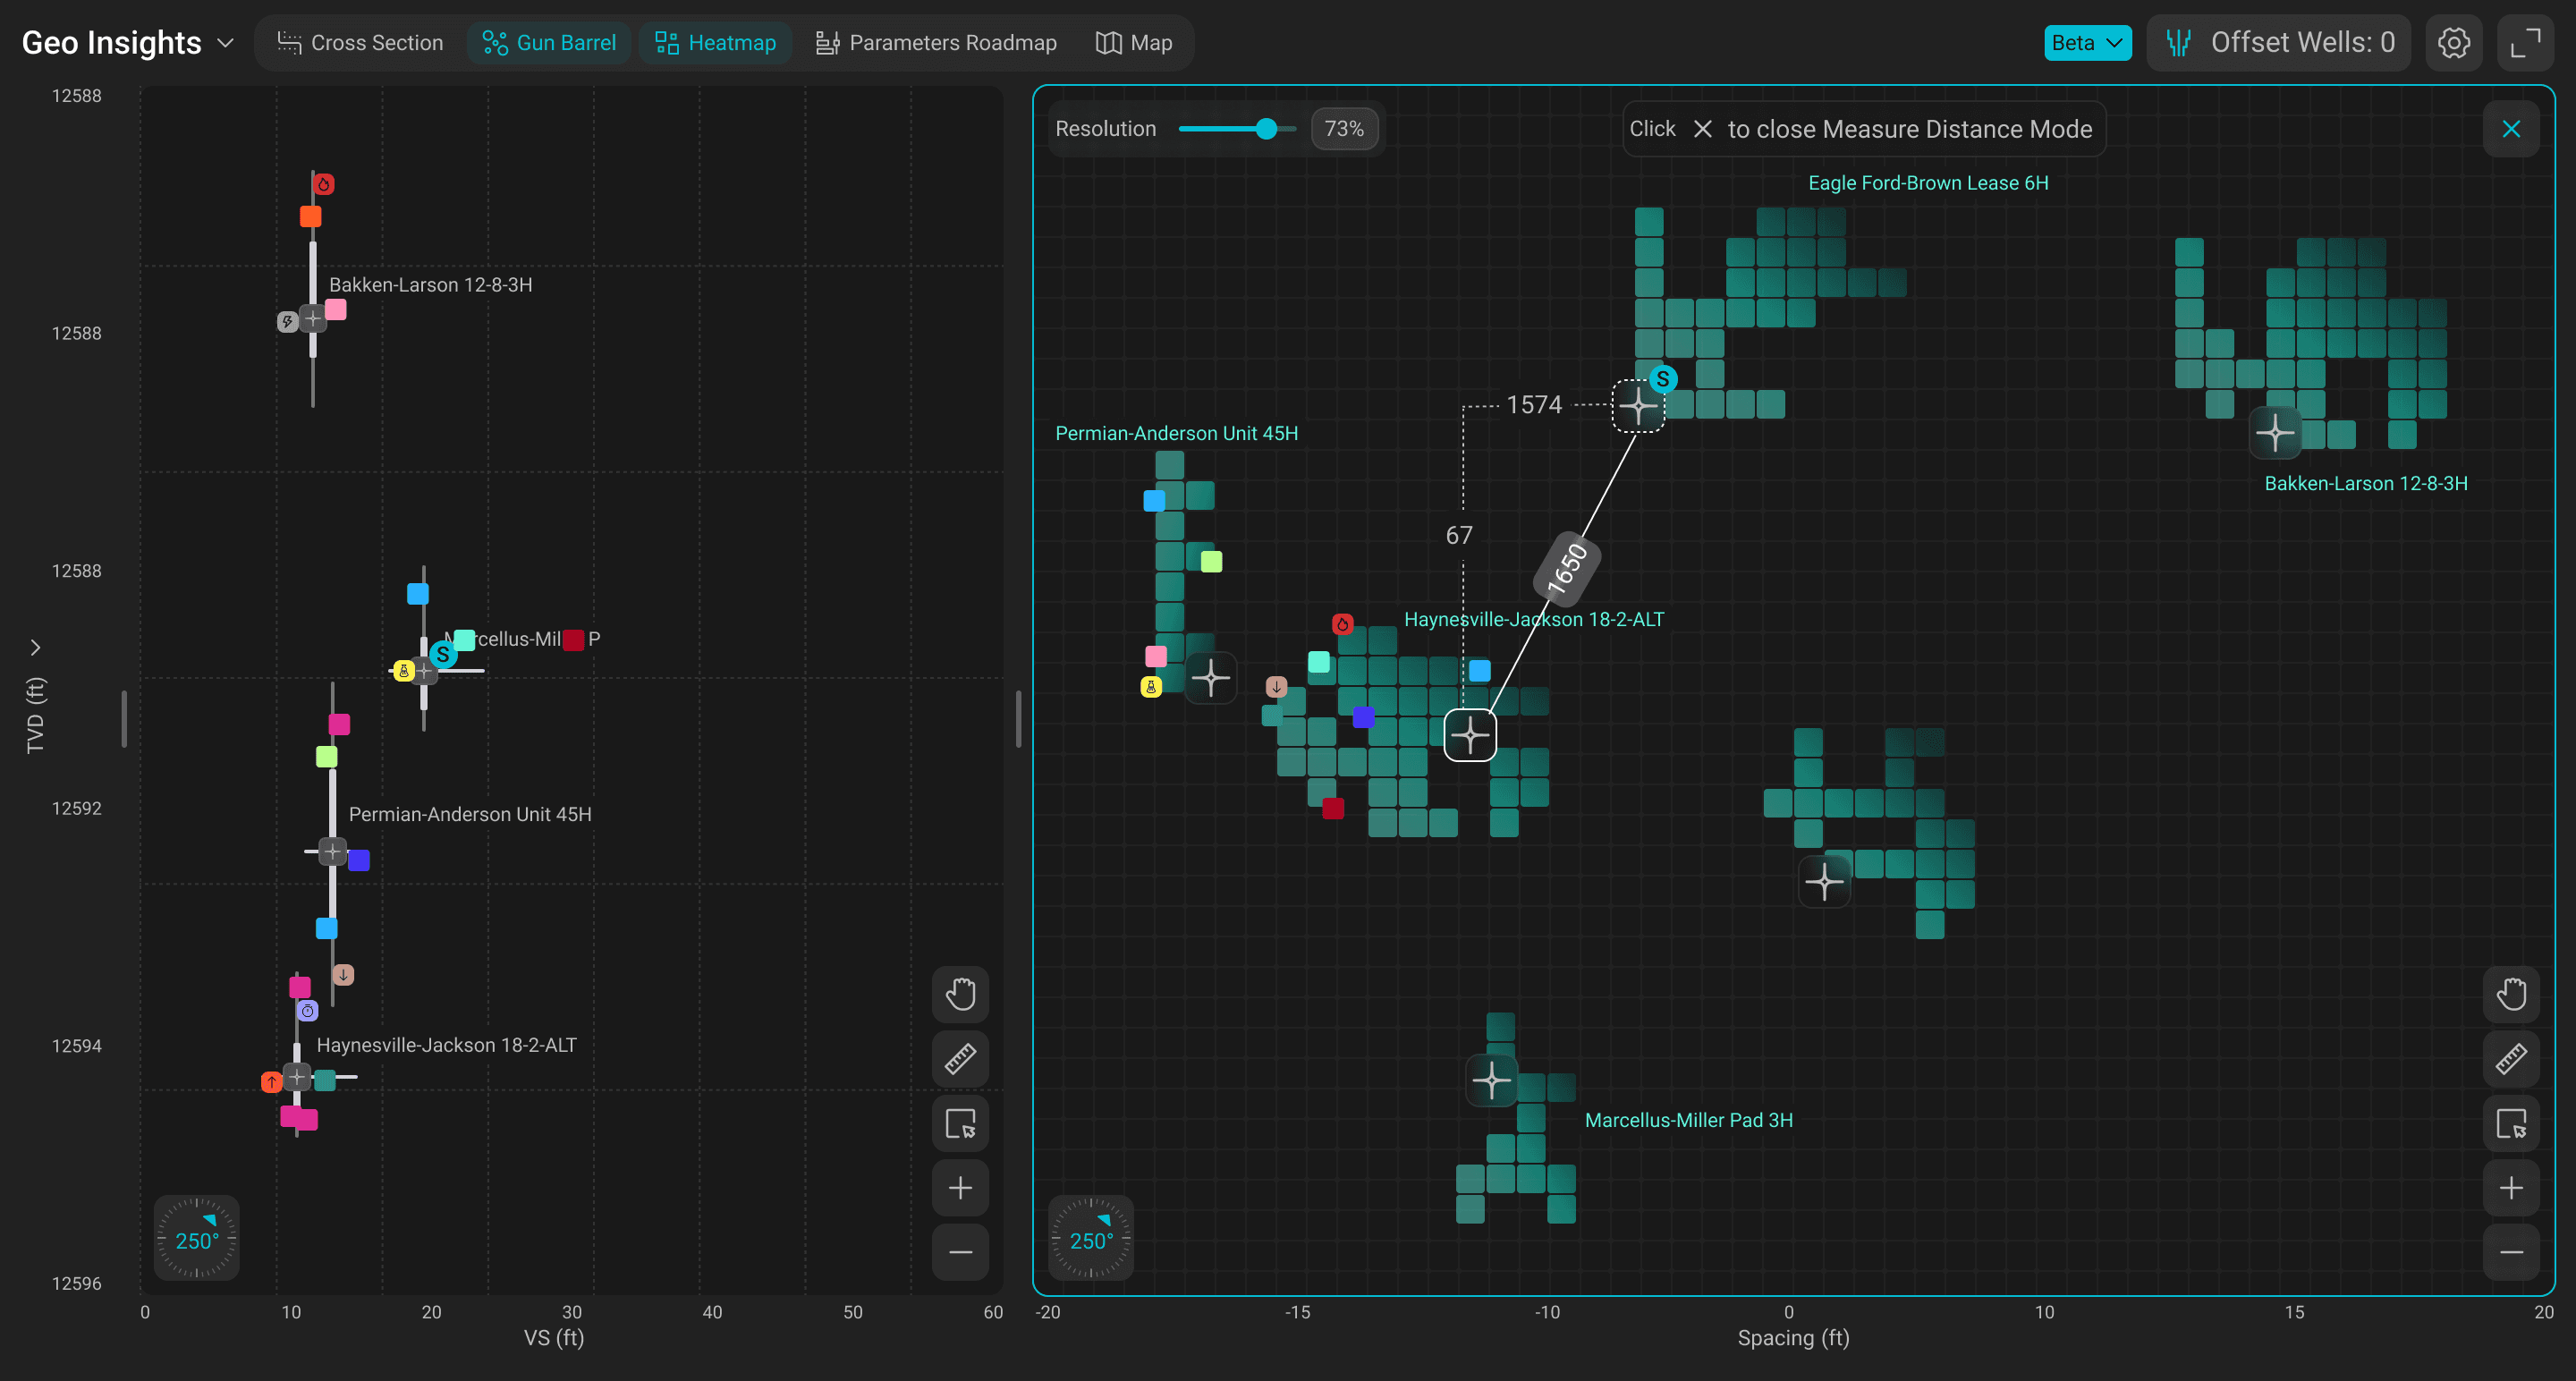
Gun Barrel view: a new visualization paradigm
The Gun Barrel view was the newest and most complex addition. It's a vertical cross-section view that shows multiple horizontal wells as if you cut a slice perpendicular to the laterals - essentially looking from behind the drill.
Key design elements
- Well plan shown as a dotted target line for reference
- Drilling window boundaries showing acceptable deviation
- Formation target lines (BOT & TOT) from geological data
- Heatmap overlay showing where the bit spent the most / least time
- Support for both 2D and 3D viewing modes with rotation
- Slide vs. rotary drilling segments visually distinguished (straight vs. curved lines)
- Real-time updates with survey point tracking (last 5–15 connections)

4.4
Preserving what worked
Consolidation didn't mean starting from scratch. Each original app had proven features that users relied on - and all of them carried over into Geo Insights. The difference: now they talk to each other.
From Well Map
- Interactive map with color-coding
- Well filtering by rig / status
- Hover details on wells
From Formation Insights
- TVD / RSD / NSD modes
- Stratigraphic alignment
- Up to 50 offset wells
From Target Formation Roadmap
- Granular subzone data (ROP, MSE, GR, WOB)
- 0.5 ft binning
- Individual Traces / Stacked Average / Average


Design decisions that shaped the product
Unification over coordination
The PM's proposal - a separate filter app to synchronize standalone apps - would have been faster to ship but would have created a fifth widget with its own UI patterns. Users were already overwhelmed managing three app settings independently. I advocated for true unification: one app, one settings layer, one state. This was harder to build but fundamentally better for the user experience. Users now configure once and see results everywhere.
Three vertical scale modes as a first-class feature
TVD, RSD, and NSD aren't just settings - they're entirely different ways of understanding well data. TVD shows absolute depth, RSD removes formation dipping by flattening on a horizon top, and NSD goes further by normalizing thickness between two horizons. Making mode switching instant and visible across all views was critical.
Passive monitoring vs. active analysis
Research showed that different views serve different interaction patterns. Gun Barrel is largely passive - it sits on a screen and users glance at it. Formation Insights is active - users zoom, pan, select wells, change alignments. The UI had to support both patterns within the same app without forcing one interaction model on all views.
Cross-highlighting as the connective tissue
The single feature that most validated the consolidation decision. When a user hovers over a well on the map, that well lights up in the trajectory view, the roadmap, and the gun barrel. This was technically impossible with separate apps and was the most requested capability. It transforms Geo Insights from a collection of views into a coherent analysis tool.
TVD / RSD / NSD - how the same wells look in each mode
Shows absolute depth - no corrections applied
Use: Quick orientation, surface-referenced analysis
Flattens on selected horizon top - removes formation dip
Use: Comparing well placement in the same formation
Flattens + normalizes thickness between 2 horizons
Use: Comparing wells drilled in different-thickness zones
Launched and scaling
Geo Insights shipped to production in March 2026 - approximately 2 months after the consolidation decision. Within weeks, weekly usage climbed to ~2,100 and continues to grow rapidly (+400% week-over-week in the early weeks).
Key outcomes
3 apps → 1 - Well Map, Formation Insights, and Target Formation Roadmap unified into a single product
Gun Barrel view - new visualization type added within the unified app
Synchronized filtering and cross-highlighting - the feature users had been asking for, now possible for the first time
Beta testing - with Shell, a major Middle East operator, YPF, and ExxonMobil
Actively evolving - new features in development based on early beta feedback

A product with momentum
Geo Insights is in its earliest production phase but already has significant client attention. The beta is active with four major operators, and feedback is shaping the next wave of features.
The consolidation opened up possibilities that weren't feasible with separate apps - deeper cross-view analysis, shared templates, and eventually AI-assisted pattern detection across wells and formations. The foundation is built. Now we're expanding what it can do.
Additional Screenshots


