Traces App
Redesigning Corva's flagship real-time drilling platform from scratch
~30,000 (peak 52K)
Weekly active uses
Shell switched off competitor
All Shell rigs now on Traces
$21M
Prevented operational loss
$9.45M
Cost savings across 10 wells
+20%
Usage growth after redesign
1.35 days
Time saved per well
Overview
Role
Sr. Product Designer - sole designer
Team
1 PM · 2 Developers · 1 QA · 1 Designer
Timeline
~6 months to release · 2 years in production
Status
Live · actively evolving
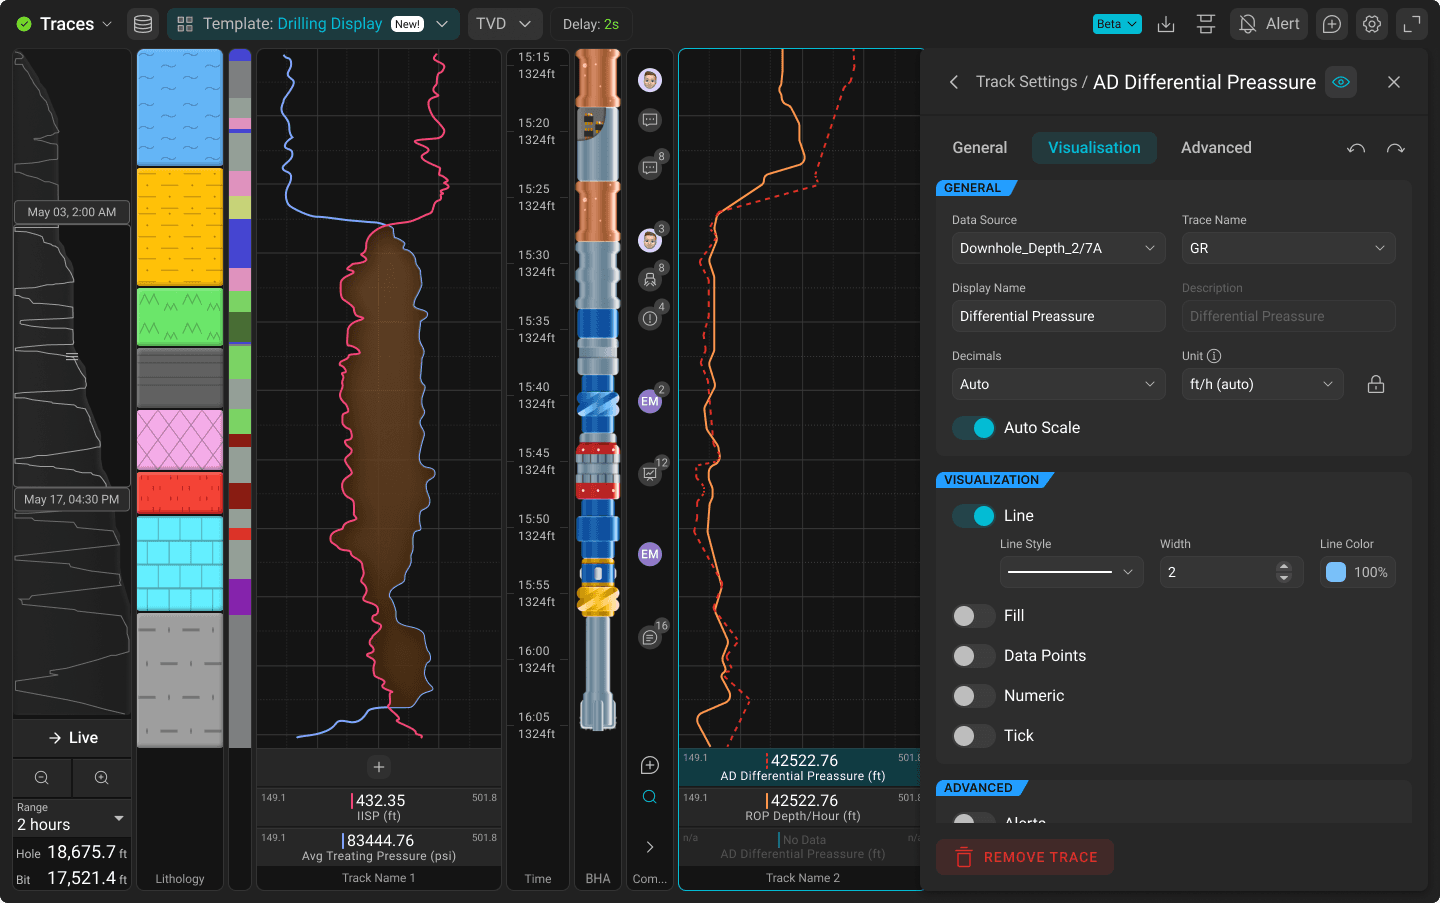
Traces is Corva's flagship real-time drilling monitoring application - the product engineers and drillers keep open 24 hours a day, 7 days a week while a well is being drilled. It visualizes hundreds of real-time data channels simultaneously: rate of penetration, weight on bit, standpipe pressure, ECD, gamma ray, hookload - all streaming live from sensors thousands of feet underground.
Used by Shell, ExxonMobil, YPF, Tecpetrol, Baker Hughes, and Nabors, Traces is the lens through which drilling teams make critical decisions in real time - decisions that can prevent blowouts, save days of rig time, and protect crew safety.
Why we rebuilt from scratch
The original Traces app had a fundamental limitation: it only supported Time-based data. Engineers could scroll through time - but couldn't view data correlated to drilling depth, which is often the more meaningful dimension for geological and performance analysis.
Beyond the depth/time gap, the old app had accumulated severe technical debt. The codebase was fragile - adding new features meant risking breakage across the entire system. Performance degraded badly on large datasets. Bugs were frequent and hard to fix.
Meanwhile, competitors were moving faster.
“If we cannot displace this app with Corva, we are in a bad situation.”
- Sebastian, Corva internal
Two years later, the opposite happened: Shell migrated their full rig fleet onto Traces, replacing the competitor platform they had run for years. The product they were worried would lose became the one their entire fleet runs on.
Core problems to solve
- Time-only data → needed Time and Depth modes, synchronized in one view
- Performance: scrolling through large datasets caused 500ms+ frame drops
- Templates were confusing - users couldn't tell which was active, duplicates proliferated
- Track Settings overwhelmed users with options they didn't need


Understanding the users
Before designing anything, I ran user interviews with engineers from Shell, Tecpetrol, Hess, and Corva's own internal team. The research goals were simple: find the biggest pain points, and understand what they actually needed that the app couldn't do.
Dustin
Drilling Mechanics SME
Shell · USA
Tasks
- Find improvement opportunities
- Compare wells
- Spot deviations
- Verify data quality
Pain points
- No horizontal view
- No mnemonic search
- Export missing units
- Performance lag
“Traces doesn't do: viewing time data horizontally. Adding more tracks in one trace. Toolface data.”
Germann
Project Engineer
Tecpetrol · Argentina
Tasks
- Monitor ROP
- Overall drilling performance
- Technological solutions
Pain points
- Performance #1 issue
- Track settings complex
- Zoom icons missing
- Small font size
“Track setting difficult to use. The user sees many settings, but he does not need them all.”
Mark
Real-Time Monitoring Center
Hess · USA
Tasks
- Day-to-day operations
- Data integrity checks
- Onboarding new people
Pain points
- Template settings hard
- Reverse scales missing
- No data smoothing
- Export broken
“Make Trace settings easier. Add option to smooth data. Add more format types.”
Performance is #1 pain - named independently by every user
Templates confusing - can't tell which is active or how to save
Missing features vs competitors - horizontal view, reverse scales, gradients
Pain points by severity

From zero to 30,000+ weekly uses
4.1
Architecture first: solving Time + Depth
The most fundamental design challenge was enabling two data modes - Time-based and Depth-based - in a single synchronized view. This wasn't just a UI problem. It required rethinking how tracks, headers, the navigation slider, and the depth/time scale all related to each other.
I worked closely with the engineering team to define the data architecture alongside the UX. Different data collections were queried based on zoom level for performance: raw WITS data for under 1 hour, summarized data for longer ranges. The UI had to reflect this gracefully - showing high-resolution data when zoomed in, and smooth aggregated curves when zoomed out.
App structure - UI zones

4.2
Performance as a design problem
When we got user reports of extreme lag on large assets, I was part of the team that diagnosed the problem and evaluated UX tradeoffs for each fix. The core issue: with 15+ tracks open simultaneously, each scroll event triggered all charts to recalculate at once - up to 500ms per frame.
We evaluated four optimization strategies, each with its own UX tradeoff.
Problem
15 tracks × 10ms per chart = 150ms per frame. Target: 16ms (60fps).
1fps
before → slideshow
60fps
target → realtime
1. Simplify data during scroll
Charts replot to low-res while user is actively scrolling
2. Stagger chart updates
Each track updates independently via idle callbacks
3. Decouple scrollbar from rendering
Scroll position updates first, charts follow every 20–50ms
4. Virtualize off-screen tracks
Don't render tracks hidden outside the visible viewport

4.3
Redesigning Templates
Templates save the entire app state: track layout, trace settings, alerts, headers, orientation. But the original system had created a UX mess - three template types lived in one flat list, editing a Default auto-cloned it, and users couldn't see which template was active.
Before - V1
✗One flat list - all types mixed
✗Active template not indicated
✗Edit Default → auto-clone created
✗Users can't tell which is active
After - V2
Corva Defaults
Company Defaults
My Templates
Shared with me
✓4 clear categories, visually separated
✓Active template always highlighted
✓Edit Default → explicit Save as new prompt
✓Company admins control org defaults
−35%
configuration time
−60%
template errors

What started as the Traces template redesign became the base for a platform-wide component, now adopted across 20+ apps.
See the component on the Design System page4.4
Horizontal View
Engineers monitoring pressure testing operations - Formation Integrity Tests (FIT), Leak-off Tests (LOT), Casing Integrity Tests (CIT) - need to see data horizontally. Pressure spikes and pump rates are far easier to read on a horizontal timeline. Competitors offered this. Corva didn't.
I designed the horizontal orientation mode as a Settings toggle with an optional auto-orient button. The challenge was adapting track headers, the depth/time scale, memos, and the activity detection bar for a rotated layout - while keeping the overall experience consistent with vertical mode.

What we shipped - and what it meant

$21M
Blowout prevented
A drilling team monitored rising Standpipe Pressure, ECD, and fluid gains signaling a potential blowout. They acted before it happened. Estimated cost of the prevented incident: $21 million.
$3M/yr
North Sea fleet savings
A North Sea operator used Traces to monitor weight-to-weight connection times. 50% reduction in average connection time on one section, 2.64 days saved across the campaign, nearly 10 days saved across a 5-rig fleet in one year.
$267K+
Hidden costs identified
Corva's hookload analytics inside Traces detected 3.7 min/connection on a Latin American rig - nearly double the 2-minute target. Corva identified connection start 1.5 minutes earlier than competitor tools. Fixing it unlocked $267K+ in annual savings.
+20%
Regular usage growth
After the redesign launched, regular usage of Traces grew by 20%. The product that was once a liability became the product engineers choose to keep open all day.
Shell switched off the competitor
All Shell rigs now run on Corva Traces
Shell migrated their entire rig fleet to Corva Traces, replacing the platform they had run for years. The redesigned product earned enterprise trust at fleet scale.
~30,000 weekly uses (peak 52K in January 2026) - consistent, sustained engagement across all client rigs. Engineers at Shell, ExxonMobil, YPF, Tecpetrol, Baker Hughes, and Nabors use it daily.
Data resilience - when a WITSML outage disrupted a client's data feed, Traces seamlessly switched to a backup feed. No retraining. No reconfiguration. Operations continued without interruption.

Still evolving
Traces launched two years ago and hasn't stopped. ~30,000 weekly uses (peak 52K in January 2026) means the feedback loop is constant - users report issues, request features, and push the product further every week.
The current technical challenge is data latency: sensor data travels through third-party infrastructure before reaching Corva, introducing up to 10 seconds of delay. Competitors with proprietary sensors have an advantage here. The engineering team is working on it.
From the design side, we continue adding new visualization types, improving the template system, extending horizontal mode, and exploring new ways to surface anomalies before they become problems.
The webinar “Aligned by Design: How Traces Brings Well Data Together” - attended by engineers from across the industry - was one signal that the product had matured from internal tool to industry reference.

Additional Screenshots


.png&w=1920&q=75)


